Revenue context. A website starts with a specific task: calculating a ratio, playing a short game, selecting a tool, or completing image and video work. Revenue comes from value created while completing that task. An advertising site sells access to attention through the ad market. A paid tool charges its users directly. A directory may also collect submission, placement, or affiliate fees from product companies. Identify the payer, the purchase, and the delivery before deciding on pages and promotion.
Revenue evidence. A January 2026 account explains paid tools as payment for efficiency. It compares an illustrative US office wage of $20–30 per hour with tool subscriptions of $9.90 or $19.90 per month, and shows monthly prices of $29.90, $49.90, and $149.99 against a video-streaming annual price of RMB 249, approximately $36. These are contemporary descriptions and revenue price examples. Validate current wages and payment willingness separately. Validate how much time a particular occupation saves on a particular task, whether output quality is sufficient, and whether the price beats alternatives.
The paid-product loop is researching needs and search language, building a site that completes the task, providing a controlled trial, acquiring relevant users, letting them experience the result, integrating payment, and delivering. The revenue record mentions payment providers as historical channel choices. This revenue chapter repeats no account-opening procedures. Eligibility for each region and entity needs current checks. Include trial costs, servers, APIs, payment fees, refunds, and support in the cost sheet. Search optimisation charges no per-click fee, but revenue research, development, content, and maintenance still cost money.
Revenue: Turn $100 per day into testable assumptions
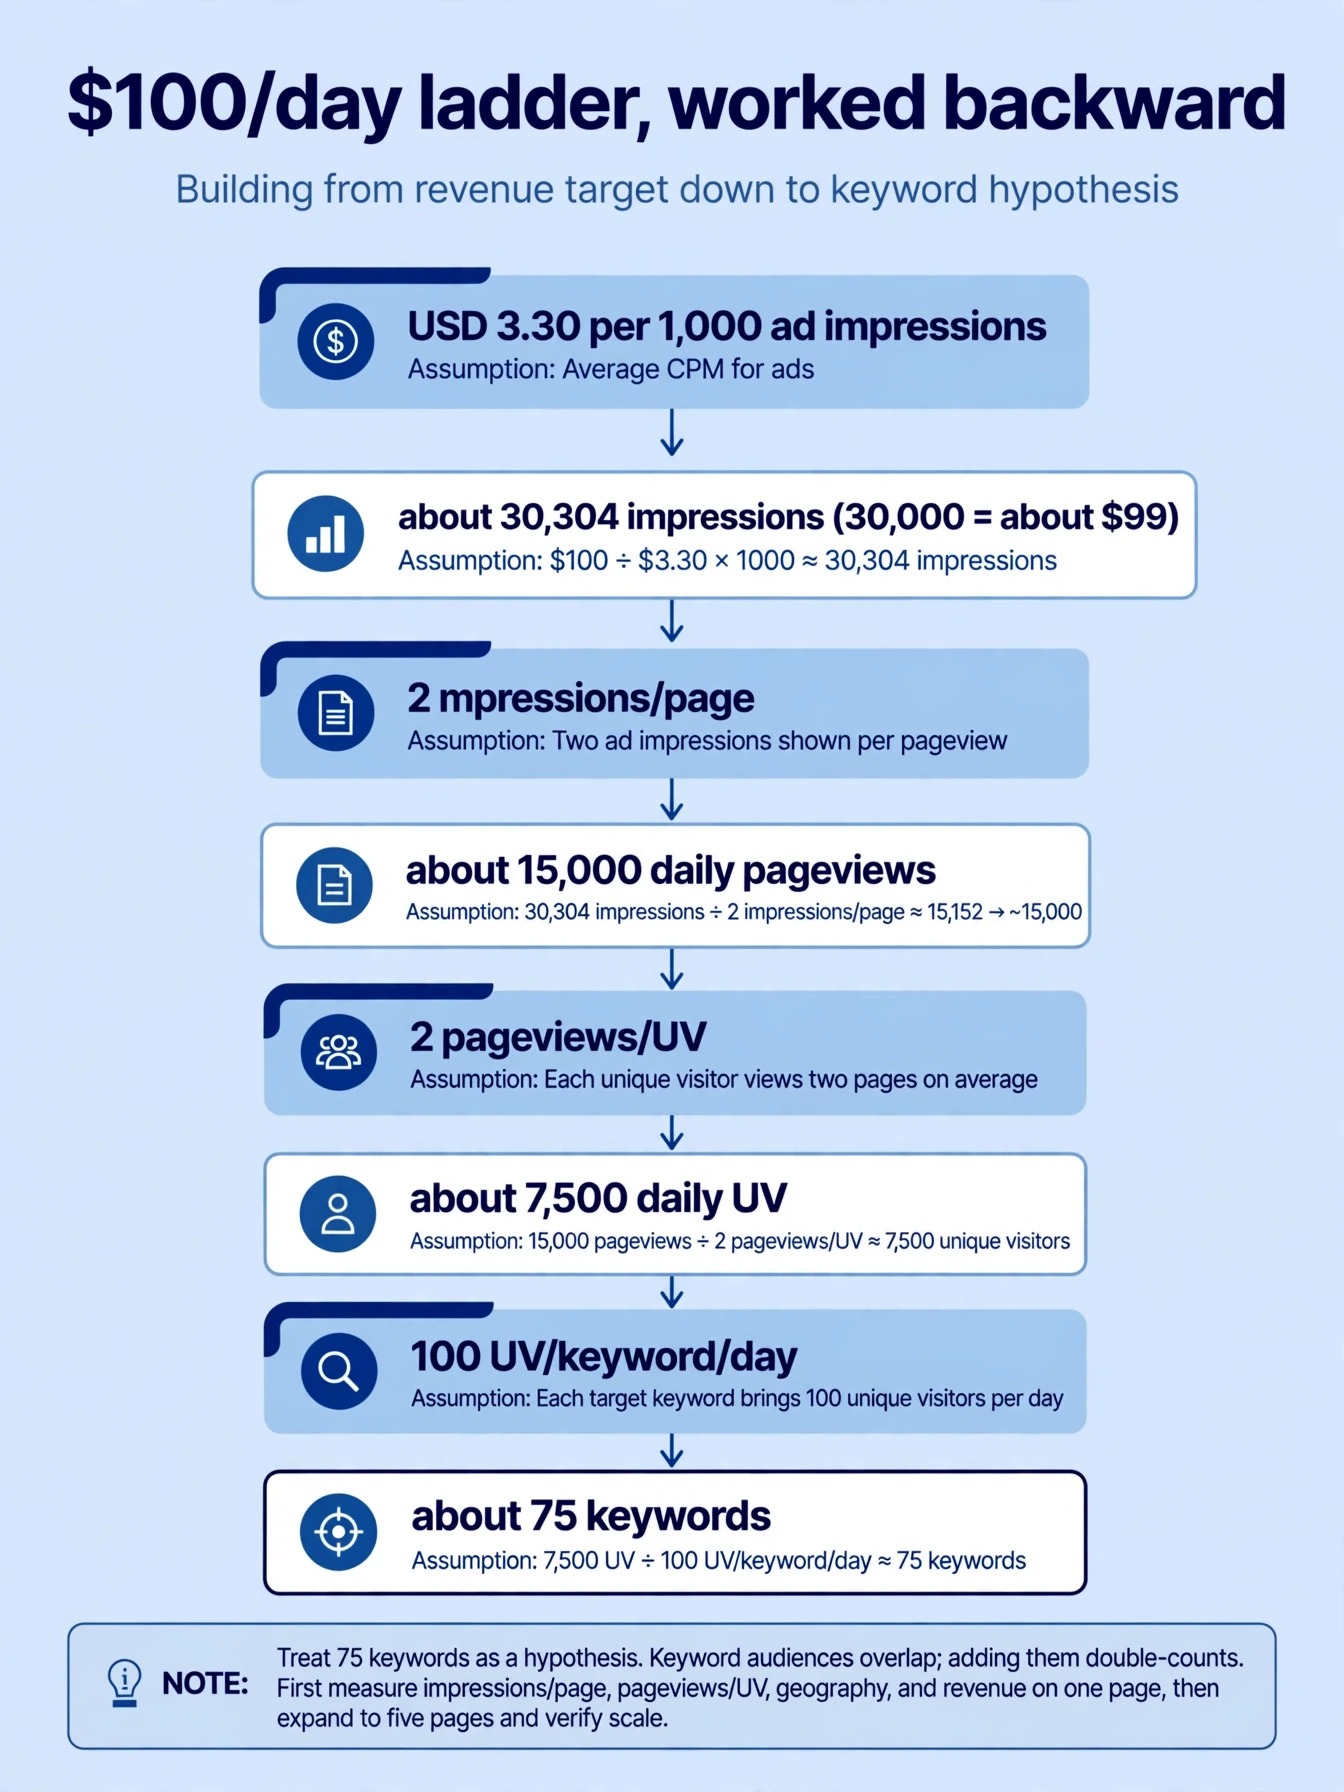
Revenue evidence. A July 2023 revenue ad model works at $3.30 per thousand ad impressions: roughly 30,000 impressions generate $99, and exactly $100 requires about 30,304 impressions. At two ad impressions per page view, this requires roughly 15,000 daily page views. At two page views per unique visitor, roughly 7,500 daily unique visitors. At 100 unique visitors per keyword per day, roughly 75 such keywords. The revenue record places three ad slots on a page but assumes only two impressions on average, showing why slot count and actual impression count differ.
These revenue conversions are teaching assumptions. The effective-revenue metric expresses revenue per thousand ad impressions. Page RPM uses a thousand page views, so the denominator differs. Visits also differ from unique visitors. Keywords may attract overlapping users. Adding keyword audiences together overcounts. First measure actual impressions per page view, page views per unique visitor, geography, and revenue on one page, then expand to five pages and verify scale. Treat 75 keywords as a hypothesis. Revenue promises need measured funnels.
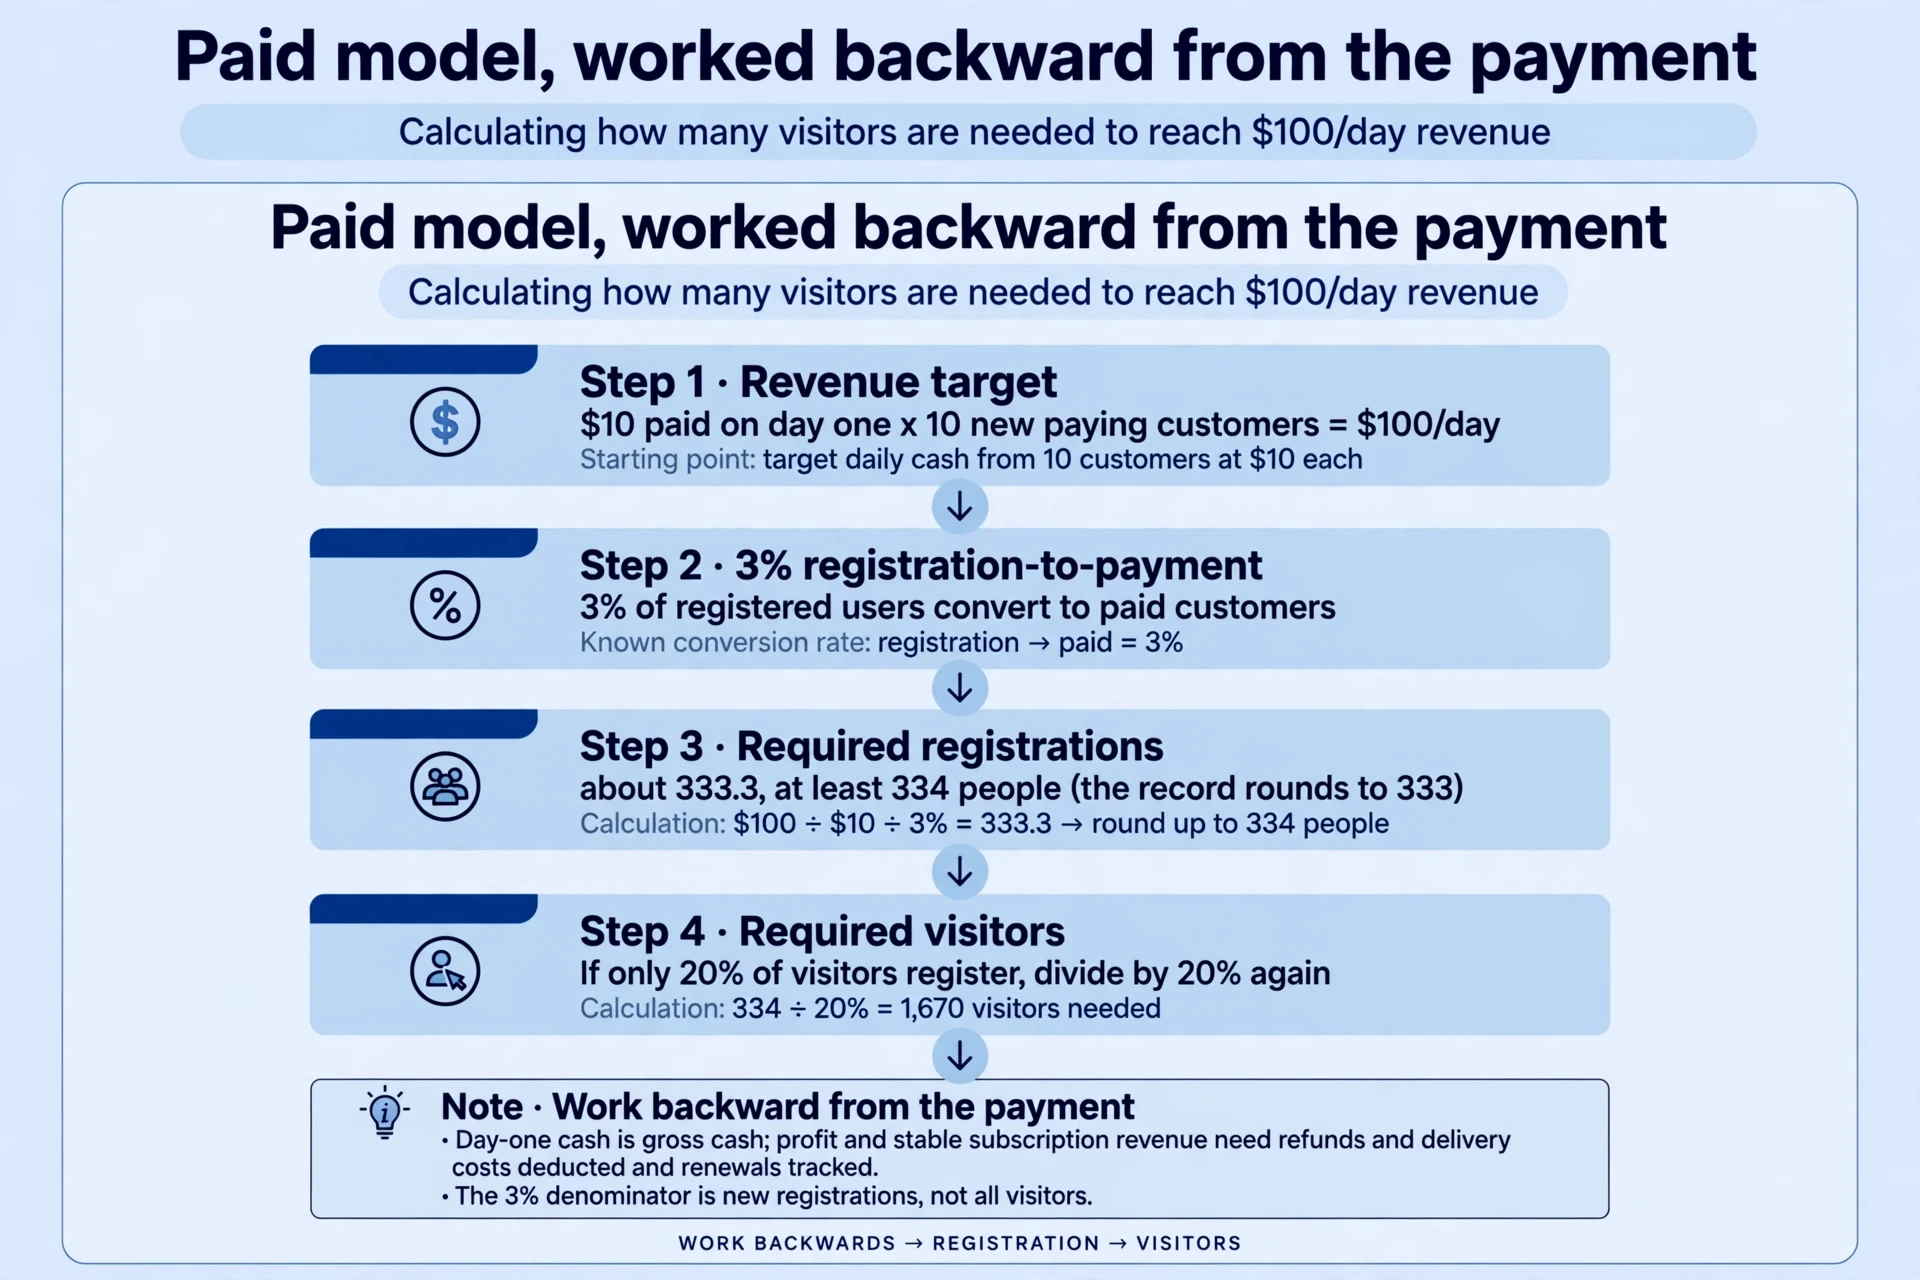
The paid revenue model assumes $10 paid on day one by each new paying customer, requiring ten new paying customers daily. At a 3% registration-to-payment rate, that needs roughly 333.3 registrations, or at least 334 whole people. The revenue record rounds to 333. The denominator of 3% is new registrations, not all visitors. If only 20% of visitors register, divide by another 20%. Day-one cash collected is gross cash. Profit and stable subscription revenue need deductions and renewal tracking. Deduct refunds and delivery costs, track renewals, and work backward from the payment.

Revenue: Keep three layers of uncertainty in competitor estimates
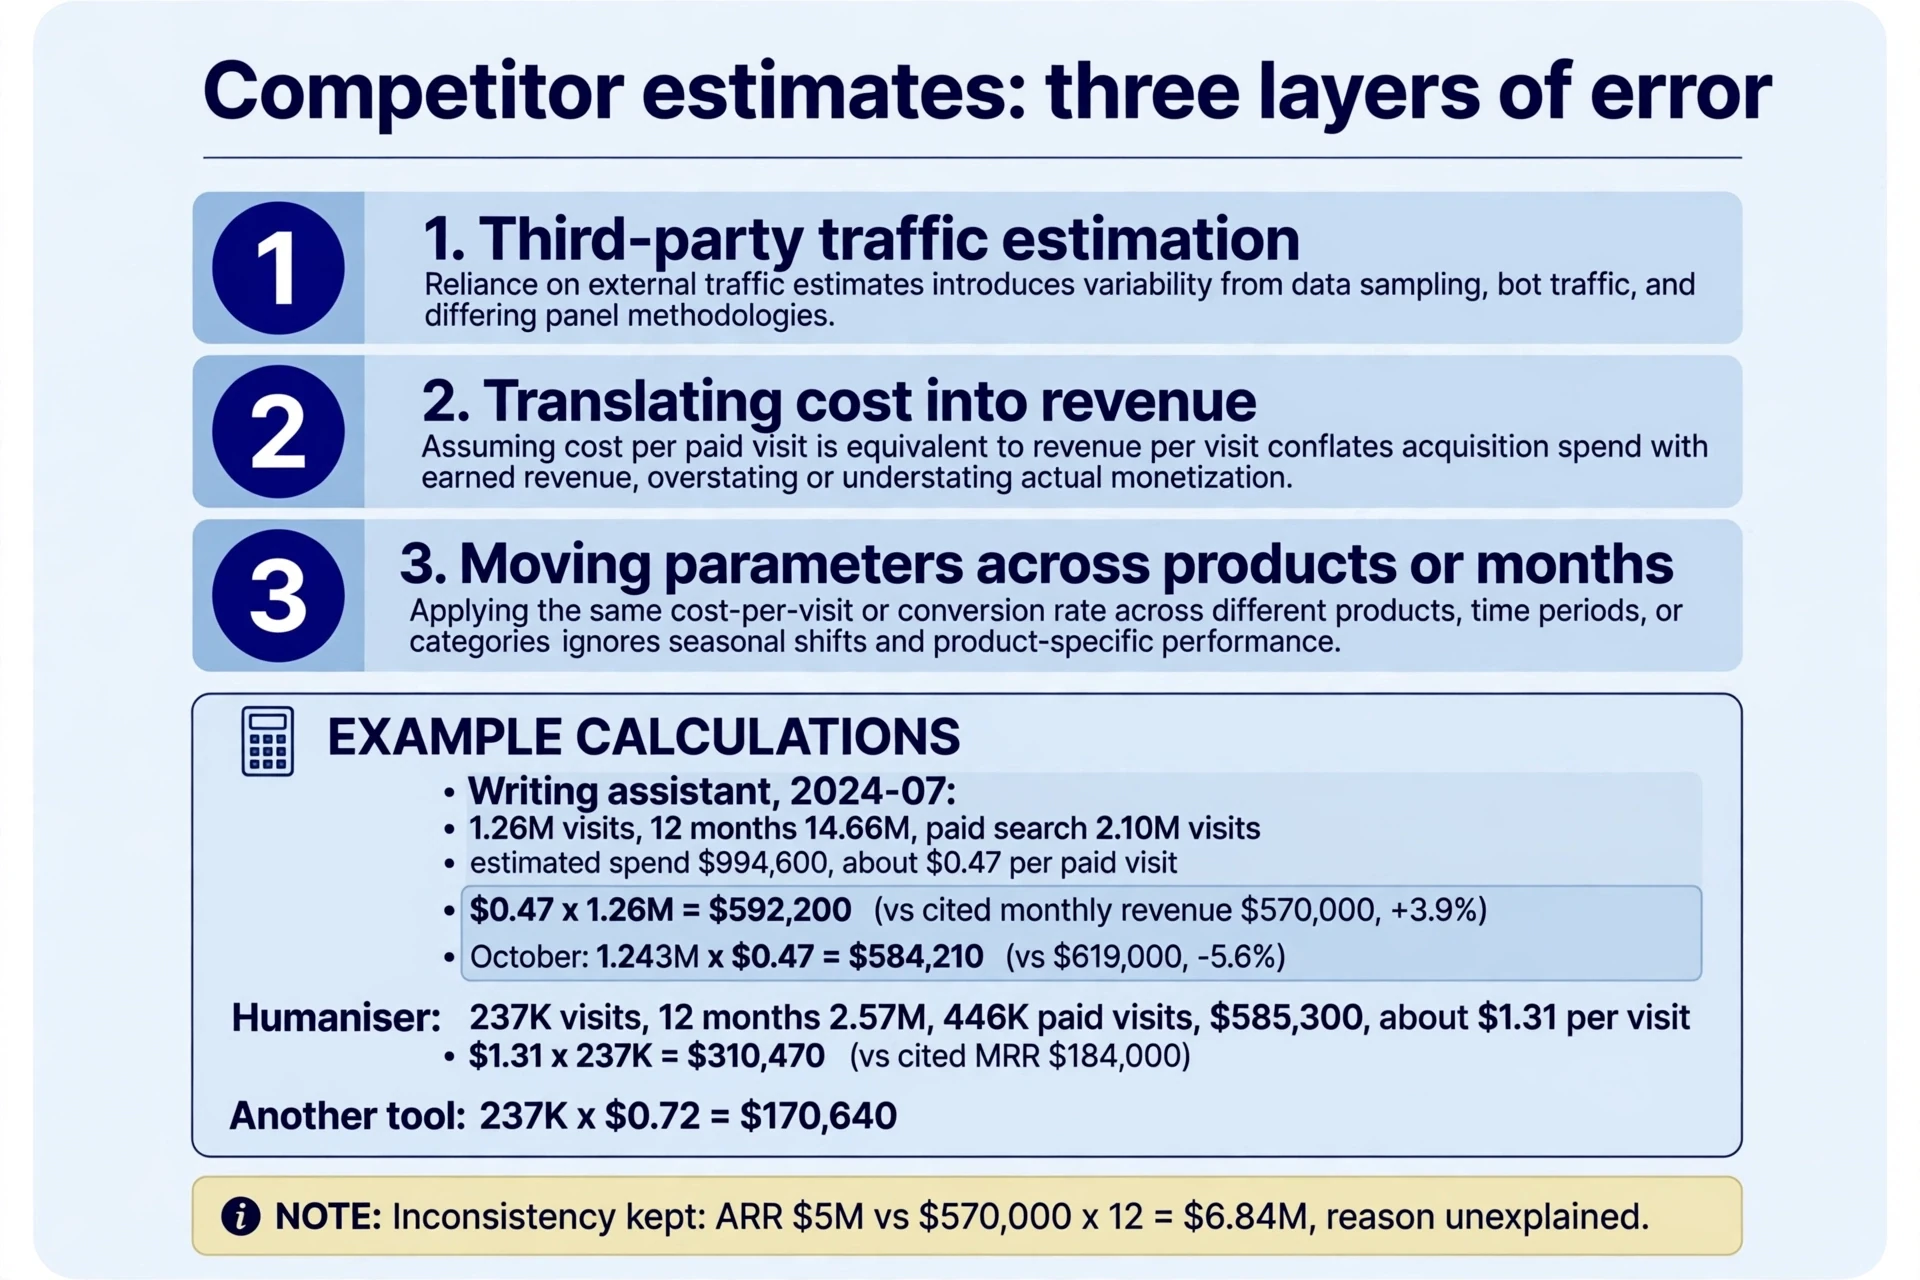
Revenue evidence. A November 2024 estimation takes total visits, paid-search visits, and paid-search spending from an estimation service, divides spending by paid-search visits to obtain average cost per paid visit, then treats that cost as unit traffic value and multiplies it by total monthly visits to estimate revenue. Its three premises are relatively stable revenue conversion and traffic value, similar audiences for similar businesses, and rational long-running advertisers that recover their costs. All require validation: acquisition may lose money, paid and organic visitors may convert differently, and subscription renewals may not align with current-month visits.
The estimation gives one AI writing assistant 1.26 million visits in July 2024, 14.66 million visits over twelve months, 2.10 million paid-search visits, and estimated ad spending of $994,600, yielding roughly $0.47 per paid visit. Multiplying by 1.26 million gives $592,200, roughly 3.9% above the $570,000 monthly revenue cited from a founder community. October’s 1.243 million visits times $0.47 yields $584,210, about 5.6% below $619,000. These benchmarks are public revenue figures cited at the time. The revenue record contains no payment ledger. Independent audits need the companies’ own accounts.
Revenue evidence. An AI humaniser tool has 237,000 July visits, 2.57 million annual visits, 446,000 paid-search visits, and estimated spending of $585,300, giving roughly $1.31 per visit. Multiplication yields $310,470, far above the cited $184,000 monthly recurring revenue. The author interprets this as premium-priced expansion and substitutes another humaniser tool’s $0.72 unit cost, giving $170,640. The other tool has 2.40 million July visits, 38.80 million annual visits, 3.62 million paid-search visits, and estimated ad spending of $2,605,100. $0.72 yields $1,728,000, while applying the first tool’s visit-to-revenue ratio gives approximately $1,863,300. Both are revenue estimates. Verification needs each company’s own accounts.
October’s 349,800 visits for the first humaniser tool times $0.72 yields $251,856, approximately 15.5% below the cited $298,000. Three layers of error arise from third-party traffic estimation, translating cost into revenue, and moving parameters across products or months. The chart also lists the writing assistant’s ARR as $5 million, inconsistent with $570,000 monthly recurring revenue times twelve ($6.84 million). Timing or definitions may differ. The revenue record leaves this unexplained. Use actual accounting and analytics for your own site and scenario ranges for competitors. Certain monthly revenue needs the competitor’s own accounting.
A frontend-only tool: separate longevity from verified revenue
Revenue evidence. A May 2025 case shows an aspect-ratio calculator implemented with frontend HTML and JavaScript, surrounded by advertising. Its title reports 61% organic search and 22% US traffic. The body gives 3.65 million visits over twelve months, about 10,000 daily and 300,000 monthly. The domain was registered on 13 March 2015 and the first version launched 27 March. The author observes roughly 80% similarity ten years later. The useful revenue lesson is that a task may retain demand. Static pages still need maintenance.
Revenue evidence. Traffic did not rise continuously for ten years: it generally grew from June 2015 to April 2019, declined for over half a year, and stayed relatively stable for about a year and a half; it grew again from June 2021 to November 2022, then fell for two months and fluctuated modestly afterward. The external trend chart leaves the declines and the revenue ad-value question open. Check accuracy, mobile interaction, loading, obstruction, and return usage together.
The author benchmarks another site with 415,000 April visits and $4,877 in advertising revenue, applies an undisclosed traffic coefficient, and estimates over $3,000 monthly, over $36,000 annually, or roughly RMB 260,000. Ten years and a 0.5 coefficient then produce RMB 1.3 million cumulative revenue. Revenue from the comparison site describes the revenue comparison site. The analysed site’s revenue needs its own records. Geography, impressions per page view, placement, historical traffic, and exchange rates may differ. The revenue record’s certainty about exceeding RMB 1 million goes beyond the archived revenue evidence. Retain the lessons of low complexity and lasting demand. Reproducible returns need your own measured case.
Game-site structure, expansion, and revenue ownership
A September 2025 account distinguishes casual browser games from complex multiplayer web games: the former usually have simple rules, no registration, instant play, mostly local single-player or same-device play, and sessions lasting minutes to tens of minutes. Common genres include puzzles, runners, shooters, matching, and small revenue strategy games. Technology shifted from Flash to HTML5 and JavaScript. Revenue generally comes from ads, sometimes paid ad removal, rather than complex in-game payment systems.
A typical page contains navigation, an upper ad, the game, related games on the sides, a lower ad, instructions, and search-oriented explanations.

Automatic ads are the author’s preference. Higher revenue than manual placements needs revenue RPM comparison. Validate usability and actual RPM. The author also records use of ad networks while awaiting revenue review and notes user discomfort with aggressive ads. These are historical choices and observations, not purchasing recommendations. Blocking a few categories is partial control. Complete control needs full revenue category review.
A single-game site can make the game playable on its homepage. The revenue record cites a number-puzzle game site, where multiple languages still serve the same game. If interest falls, add game pages and navigation while preserving the original homepage task, rather than replacing the existing entry point with a list. One useful page per game organises information. Ranking rules need their own revenue evidence. Avoid unnecessary pages for the same intent.
A game portal has a list homepage and may use a brand or a category domain. Two large portals are the revenue record’s examples. Operators with templates and resources may combine both revenue models from day one: one game on the homepage, with other games around it and on inner pages. One physics game site already had this structure when launched in March 2024 and was observed at 1.4 million monthly visits. Another driving game site also began with multiple pages. These revenue examples show two launches. Template duplication needs its own test. Reusing games across sites and having AI rewrite introductions is insufficient. Provide real instructions, controls, compatibility testing, and reasons to choose a game.
Developers create games, publishers connect developers and site owners, and site owners supply visits. Ad platforms pay publishers, which distribute contractual shares to developers and site owners while retaining a platform share. Developers and site owners may themselves become publishers. Other site owners use iframes: in-game ads belong to the embedded source, while surrounding webpage ads belong to the host. Count each revenue stream once, to its owner. The revenue record acknowledges some unauthorised games and shows platforms offering embed code. The practical revenue approach is verifying each publisher’s public embedding permission and terms, and recording the source, permission date, and revenue split. Embed code grants embedding permission only. Copying games or removing branding needs separate rights. A private-community flywheel diagram and later technical instalments fall outside this revenue record’s coverage — count each ad dollar once.
Revenue: A directory makes content production an ongoing operation
An October 2025 account lists four search entry points: known product brands; revenue comparisons such as one video generator versus another; category needs such as best image generator and best video generator; and long-tail queries served by revenue articles and product information. These pages answer what it is, how to choose, which options fit, and how to solve a specific problem. Rapid coverage of trending products may catch attention. Accuracy, updating, and meaningful selection still decide value.
The five revenue types are paid submissions (tens to hundreds of dollars in the revenue record), parameterised affiliate links, inner-page ads, industry or ranking reports, and credit-based promotion on positions such as the homepage. Submission fees purchase the agreed revenue review or service. Search indexing follows the search engine’s own revenue decision. Affiliate tracking must distinguish clicks, registrations, qualifying sales, refunds, and settlement. Placements need defined positions and periods. Reports need samples, dates, and methods. Public rankings are revenue estimates, not certain market shares.
The revenue record attributes authority to backlinks from listed products, strong inner pages and internal links, third-party citations, and purchased links. Navigation must genuinely help users. Avoid exchanges intended to pass ranking credit, and qualify commercial links. The author discouraged typical programmers from entering at the time because covering launches, organising many products, and maintaining updates was labour intensive. Automation that still delivered useful content might fit. This is a 2025 business judgment, open to revision, and automated collection still requires factual verification, permission, and distinctive value.
Revenue: Calculate acquisition limits and cash payback first
In an August 2026 account, one advertiser’s cumulative ad spend exceeding RMB 100 million covers years of tool apps, mini programs, leads, and overseas channels. It is spending. Revenue and profit need separate revenue records. Her six steps are accounting and market research, platform choice, revenue budget pacing, structure and iteration, stage-specific revenue planning, and building a distinctive capability. Account operation follows unit economics.
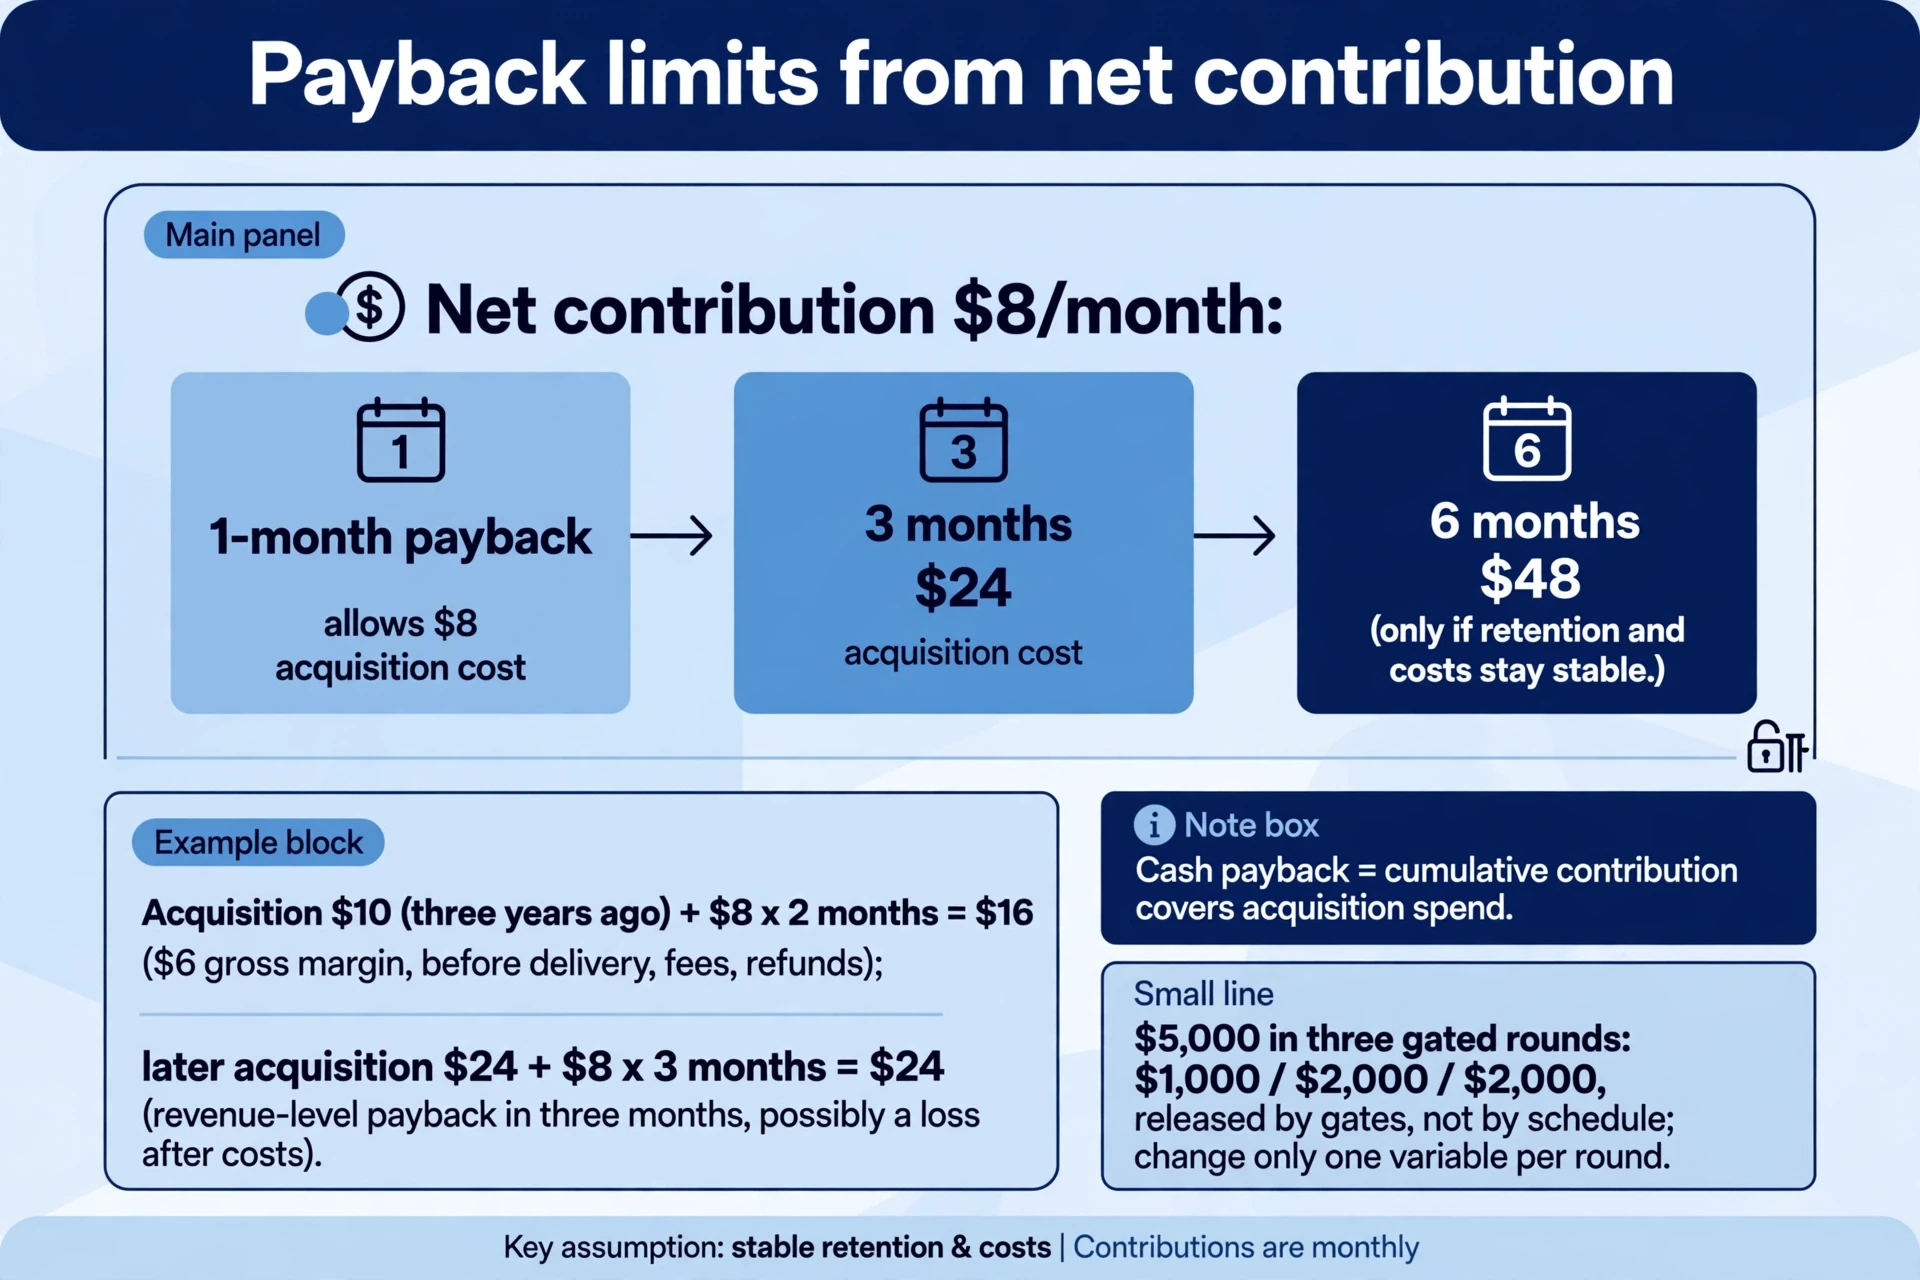
Revenue evidence. In the revenue subscription example, acquiring a payer cost $10 three years earlier. An $8 monthly price and two paid months produced $16, or $6 above acquisition cost before delivery, fees, and refunds. That $6 is gross margin before delivery, fees, and refunds. Net profit needs those deductions. Later acquisition cost $24, while the same $8 price and three paid months yielded only $24: revenue-level payback took three months, with possible losses after costs. Some early users still renewed three years later, showing that compounding comes from retention and later contribution, not the act of buying traffic. Ad sites spread initial acquisition cost across return visits and additional useful pages.
Revenue context. For each channel and signup cohort, list first payment, monthly renewals, refunds, variable delivery costs, payment fees, support, and cash arrival dates, then calculate cumulative contribution per new payer. Ad spending divided by new payers is paid-customer acquisition cost. Divided by registrations it is registration cost, a different measure. Maximum acceptable acquisition cost should sit below reliably achievable lifetime contribution with room for uncertainty. Cash payback occurs when cumulative contribution covers acquisition spend. Keep renewal averages separate for organic brand users and first-time ad users.
The revenue record recalls large companies tolerating one-year payback, smaller firms perhaps six months, and independent developers one to three months. If each user truly contributes $8 net per month, one-month payback permits about $8 acquisition cost, three months about $24, and six months about $48. These are conditional limits assuming stable retention and costs.
Bidding advice needs live revenue auction data. A user worth $100 over a year can still strain cash if acquisition costs $80 today and revenue arrives over twelve months. Update first payments, renewals, refunds, retention, and cash arrivals weekly. If payback extends from two to three months, recalculate available cash.
Match the revenue experiment to product, creative capability, and budget
The revenue record compares active search demand on a search ad platform, a social platform’s revenue audience data and mature systems, and a short-video platform’s dependence on scripts and opening visuals. These are operational observations. Platform performance guarantees need controlled tests. Ask whether users are already seeking an answer or need a demonstration, what creative the team can produce consistently, and what startup delay and cost volatility it can afford. Validate explicit tool needs with search queries and visual benefits with demonstrations. Copying another team’s platform or bids skips your own validation.
The $5,000 revenue budget example allocates $1,000, $2,000, and $2,000 across three rounds. Later spending depends on earlier revenue evidence. Releases follow gates, not a schedule.

Revenue evidence. A first-round “60% solution” means tracking creative impressions, clicks, landing, registration, core usage, payment, and cash arrival. Fixed revenue conversion-rate targets come in later rounds. A tiny one- or two-day test may yield insufficient observation, while an oversized first round burns funds before pages, payments, and tracking work. Size spending around the tolerable loss, required sample, and payback period.
Separate comparable groups by country, audience, and benefit. Ad-platform, website, product-event, and revenue payment data should explain broad differences, with attribution windows, time zones, and deduplication documented. Advice to control revenue social-platform budgets, short-video bids, and low-quality native-ad traffic is historical experience. Current interfaces need current documentation. A small team can first strengthen one capability — technical automation, revenue analysis, creative production, lower delivery cost, or channel access — and work with complementary partners. It can also observe recently growing creators for a small collaboration, judged by real users, revenue, and payback rather than views.
Walk through the historical revenue search-ad workflow
A March 2024 account prepares an email account, a search-ads account, payment setup, and revenue conversion tracking. This course produces configuration drafts and revenue test records without funding or publishing. Define a purchase-success event, amount, and currency, and use a test order to verify a single trigger and refund handling. Then document the campaign name, audience, countries, dates, revenue budget, and changes. More clicks validate nothing alone. Reliable revenue conversion definitions decide what clicks mean.
The fourteen steps are: create a campaign; choose creation without revenue goal guidance; choose Search; select predefined revenue conversion goals; name it; choose Maximise Clicks or manual CPC with a cap; keep the intended revenue search-network scope and disable unwanted defaults; select locations and presence; enter keywords and match types; enter a relevant landing page; write headlines naming the product, service, and distinctive benefit; describe advantages; set a budget; and review, publish, and await approval. Interfaces and available revenue bid strategies change. Match steps to current options, not old screenshots. Choose revenue optimisation methods that fit conversion data and revenue experiment goals.
Revenue evidence. Keywords use broad, phrase, and exact match. The revenue record recommends phrase match for beginners. Current phrase matching uses meaning rather than identical word order, so review actual search terms and exclude irrelevant intent. Headlines, descriptions, queries, and landing pages must make the same promise. A free offer in the ad and mandatory payment after arrival break that promise. The revenue record advertises a paid section of “ten rules worth $1,000,” but the saved body ends at the free introduction. Those rules were not saved and cannot be reconstructed as the author’s advice.
Checked on 22 October 2026, the search ad platform calls this an average daily revenue budget. For most campaigns, the daily charging limit is twice that amount and the monthly limit generally 30.4 times it, with exceptions by campaign and billing method. The revenue record’s wording that it is the maximum daily spend is therefore too absolute. Review revenue budget reports, applicable billing rules, and the overall revenue experiment loss limit, recording budget changes. Consult official location and matching guidance and use the options actually available before publishing.
Revenue: Let drop-offs guide the next round instead of substituting clicks for profit
Trace the visits-to-revenue chain before changing acquisition spend. For international payments, review the cross-border operating chain to reconcile transactions and receipts. After the first sale, the sustained-operations retrospectives turn support, delivery failures, and repeat demand into the next work cycle.
Revenue review. If there are no clicks, inspect creative and audience. If clicks do not become registrations, inspect promise alignment and loading. If registrations do not become usage, inspect core functionality and onboarding. If usage does not become payment, inspect price, allowances, trust, and checkout. Change one variable per round near the main problem, recording the hypothesis, version, dates, traffic conditions, and result. Make the page viable, then test creative, structure, and audience, and later platform efficiency features. Changing price, page, country, and bid together prevents meaningful attribution.
Study pain points, openings, and demonstration structures used consistently by peers, then create your own revenue examples, visuals, and copy. Test scripts, openings, duration, and landing pages separately. Saving time, reducing staffing, and automating repetitive work may attract different audiences. High clicks with low payment may reflect curiosity, so inspect registration, actual usage, renewal, and contribution together. Advertising feedback can improve products and content. Direct ranking improvement from ad spending needs separate revenue evidence.
One January 2026 account simplifies dwell time, return visits, backlinks, and authority into a ranking story. It is a reminder to improve experience. Fixed algorithm formulas need official documentation. The search platform explicitly states that paid-search investment does not affect organic rankings. Cooperation between ads and search optimisation lies in validating demand, sharing useful content, and combining channels. Commercial revenue articles, directory promotion, and affiliate links need appropriate qualification such as sponsored, rather than buying ranking credit. AI rewriting and automated listings are revenue production methods. Usefulness to people is the test.
Before the next round, rewrite four lines: contribution per user, maximum acquisition cost, maximum payback period, and initial revenue budget with continue, adjust, and stop criteria.
Practice: produce an auditable business experiment
-
How much traffic is needed for $100 daily under the record’s revenue assumptions? $100 ÷ $3.30 × 1,000 ≈ 30,304 impressions. Divide by two for about 15,152 page views, then by two for 7,576 unique visitors. If actual page RPM is $4, use $100 ÷ $4 × 1,000 = 25,000 page views without dividing again by ad impressions. State the date, geography, and revenue estimate. Treat it as gross estimated ad revenue before costs.
-
Can an $8 monthly subscription with $24 acquisition cost and three-month retention scale? Revenue is only $24, all consumed by acquisition cost. Assume $2 monthly delivery cost and $2 combined fees and refunds over three months: contribution is $16, leaving an $8 loss after acquisition cost. Validate retention, pricing, and costs before increasing spending because orders rose.
-
How should a competitor monthly-revenue conclusion be written? Record the estimation service’s month and visit definition, and assume $0.30, $0.50, and $0.80 per visit. At 100,000 monthly visits, scenarios are $30,000, $50,000, and $80,000. Explain that cost and revenue are different measures, third-party visits have error, and renewals may occur in other periods. Real accounting is required. Midpoints are scenarios, not revenue evidence.
-
Turn $5,000 into a gated revenue three-round plan. Use $1,000/$2,000/$2,000 as the historical revenue example. First validate payment and deduplication with a test order, then confirm that revenue target users traverse the funnel. Stop and repair if tracking cannot reconcile. Round two changes the main drop-off point only. Round three requires repeatable contribution and cash payback. Click-through rate alone is an earlier-round revenue metric. Set real amounts from affordable losses.
-
How do you check revenue ownership before expanding a game site? Record each publisher, public embedding permission, date, and terms. Distinguish iframe ads from surrounding-page ads. Keep the original homepage task and add useful individual pages and navigation for new games. Verify playability, clear controls, and unobstructed mobile usage. Keep unlicensed resources off the launch list.
-
What should the next round change when clicks are high but payments are absent? Check missing revenue data first, then locate the largest drop across landing, registration, usage, and payment. With 1,000 clicks, 800 arrivals, 400 registrations, 20 users, and zero purchases, inspect post-registration functionality and the ad promise before switching platforms or lowering prices. Hold country and bids stable, change one onboarding or experience element, and compare consistent usage and subsequent-payment measures.
Establish who pays, verify the arithmetic, and let each round’s revenue evidence set the next budget. Revenue models are hypotheses with price tags — test them in that order.
Comments
Join the conversation. Comments are reviewed before appearing.
Loading comments…